Performance
The figures on this page were produced by running benchmarks/bench_solvers.py
from the repository root. To regenerate the figures from a fresh benchmark run:
python benchmarks/bench_solvers.py
python benchmarks/plot_results.py
Hardware context for the results shown here:
CPU: AMD Ryzen 7 7840U (16 logical cores)
RAM: 46.4 GiB
OS: Linux 6.17, Ubuntu 24.04
Python 3.12.7 · NumPy 1.26.4 · SciPy 1.16.3
Absolute timings will differ on other hardware; relative performance between methods and cache modes is broadly representative.
Solver scaling
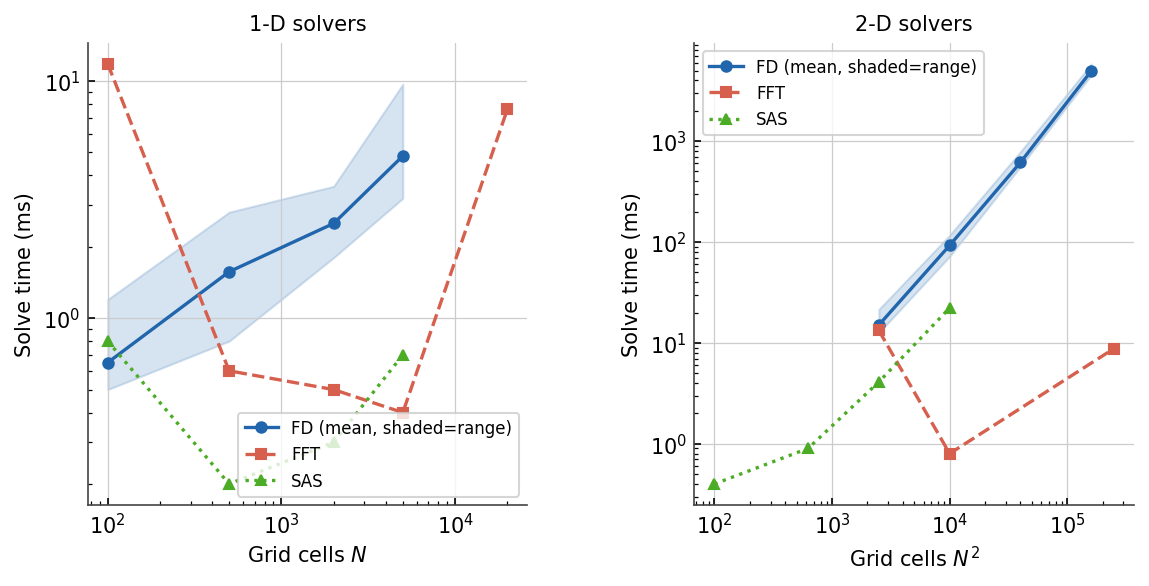
The FD direct solver uses a sparse LU factorisation and scales roughly as \(O(N^{1.5})\) in two dimensions, where \(N\) is the total number of grid cells. At 400×400 cells (\(N^2 = 160\,000\)) a single FD solve takes about 5 s; at 200×200 it takes about 0.6 s. In one dimension the cost is far lower: at 100–2,000 cells a 1-D FD solve completes in under 1 ms on this hardware, and even a 10,000-cell domain takes well under 10 ms. One-dimensional FD is effectively instantaneous at any realistic grid size.
The FFT method solves the problem in the spectral domain and scales as
\(O(N \log N)\). In two dimensions it is roughly two orders of magnitude
faster than FD at the same grid size: a 400×400 solve takes about 5 ms and a
1000×1000 solve about 40 ms on this hardware. FFT requires a uniform (scalar)
elastic thickness and imposes periodic boundary conditions (or zero-padded
behaviour with no_outside_loads).
The SAS method superposes analytical deflection kernels using
fftconvolve, scaling as \(O(N \log N)\) in total cell count. It is
load-pattern-independent and consistently faster than FD at all practical grid
sizes: at 100×100 cells SAS takes about 20 ms versus 70 ms for FD; at 300×300
cells SAS takes about 0.2 s versus 2 s for FD (roughly 10× faster). Because
the fftconvolve step scales as \(O(N \log N)\) — the same asymptotic
order as FFT — while the FD LU factorisation scales as \(O(N^{1.5})\), SAS
maintains its advantage as grids grow. SAS also requires a uniform elastic
thickness.
The Te profile has a modest effect on FD timing: the shaded band (min to max across all profiles tested — constant, sinusoidal, abrupt step, tanh sigmoidal, correlated noise, wide dynamic range) is narrow, typically within ±15 % of the mean. Spatially noisy profiles show slightly higher times at large grid sizes, likely due to increased fill-in during sparse LU factorisation.
LU factorisation cache
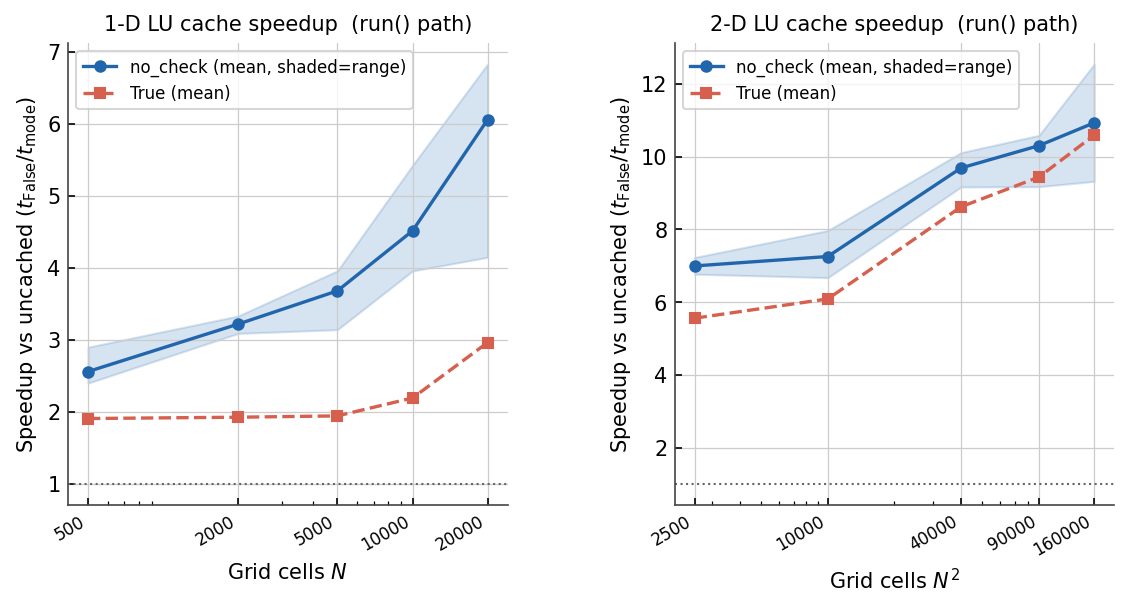
Speedup of the LU-factorisation cache (``cache_factorization=True``)
over uncached (``False``) via the full run() path.
The band shows the range across all Te profiles; the line is the mean.
The dotted line at 1× marks no speedup.
When the load \(q_s\) changes between calls but the grid, elastic thickness, and boundary conditions remain fixed, the coefficient matrix does not change. Caching the LU factorisation eliminates the cost of re-factorising on every call, reducing the per-solve work to a single triangular solve.
In two dimensions the cached mode (cache_factorization=True) reaches
7–12× speedup over uncached at grid sizes of 50×50 to 400×400 cells. The
speedup grows with grid size because the factorisation cost (eliminated by
caching) scales as \(O(N^{1.5})\) while the cached solve (triangular
back-substitution) scales as \(O(N)\).
Note
These figures were measured before the 2.0.0 cache redesign, when True
validated a matrix hash on every call and so ran slightly slower than the
hash-free "no_check" mode shown as the upper curve. That per-call hash
has since been removed — True now reuses the factorisation directly and
matches the "no_check" curve — and "no_check" is a deprecated alias
for True. Read the two curves as a single cached mode.
The timings include all overhead from a run() call: bc_check(),
coordinate setup, warning checks, and the _solve_fd() cache-bypass logic.
This is more representative of real coupling-loop performance than timing
fd_solve() in isolation.
See API Reference for usage details, including the smart invalidation mechanism
that automatically clears the cache when any matrix-determining input (te,
dx, boundary conditions, etc.) is reassigned.
Cost of changing \(T_e\)
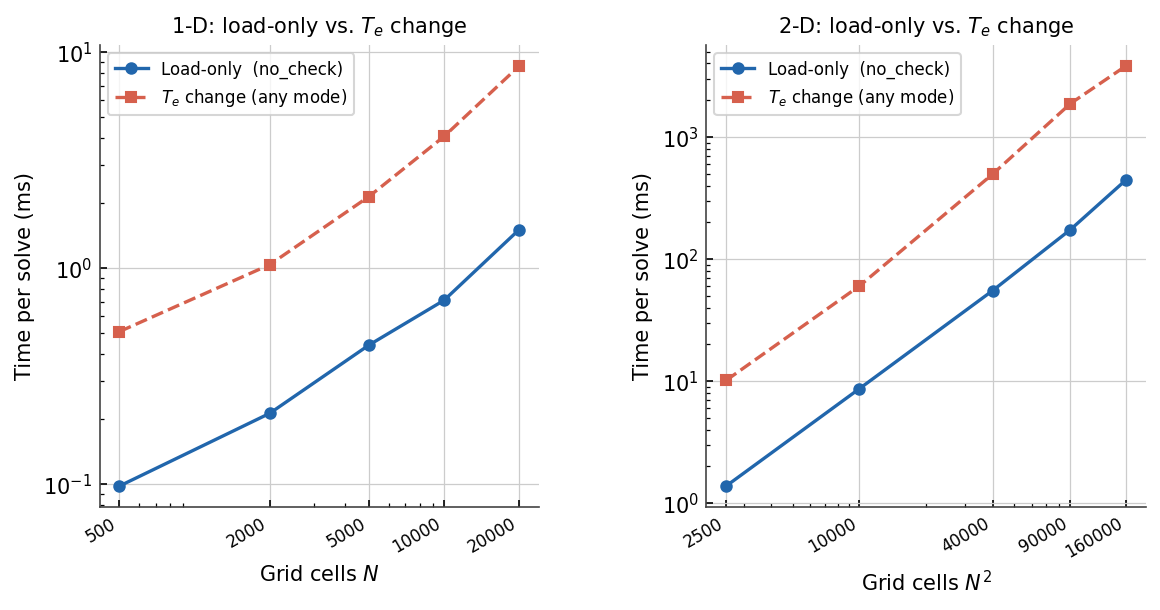
Per-solve cost when only the load changes (load-only, cached mode ``cache_factorization=True``) versus when the scalar elastic thickness :math:`T_e` changes on every call (Te change, any cache mode).
Reassigning \(T_e\) triggers smart cache invalidation: the coefficient
matrix is cleared and the LU factorisation is discarded. The next
run() call rebuilds the matrix from scratch and re-factorises.
Both cache settings (False and True) pay essentially the same cost
when \(T_e\) changes, because the rebuild dominates the per-call budget.
At 200×200 cells the load-only cost is roughly 53 ms per solve while a \(T_e\) change costs roughly 590 ms per solve — about an 11× penalty. At 400×400 cells the load-only cost is roughly 400 ms per solve while a \(T_e\) change costs roughly 5.3 s — about a 13× penalty. The gap widens with grid size because factorisation scales as \(O(N^{1.5})\) and the incremental triangular solve scales as \(O(N)\).
The practical implication: in a coupling loop where \(T_e\) is fixed and
only \(q_s\) varies (e.g., a transient ice-sheet or sediment-loading model),
cache_factorization = True provides substantial speedup.
In a parameter-sweep or inversion where \(T_e\) changes on every iteration,
both settings are equivalent and the rebuild cost is unavoidable.
Method complexity summary
Method |
Time |
Memory |
Notes |
|---|---|---|---|
|
\(O(N^{1.5\text{–}2})\) |
\(O(N^{1.26})\) measured |
Variable \(T_e\); LU memory dominates at large \(N\).
|
|
\(O(N \log N)\) |
\(O(N)\) |
Uniform \(T_e\) only. Fastest method; memory scales linearly. |
|
\(O(N \log N)\) |
\(O(N)\) |
Uniform \(T_e\) only. Memory linear; |
|
\(O(N^2)\) |
\(O(N)\) |
Uniform \(T_e\) only. Ungridded point loads; scales as the direct Green’s-function sum \(O(N_\text{load} \times N_\text{out})\). |
\(N\) is the total number of grid cells after any domain padding.
FD LU memory scaling
The FD solver’s sparse LU factorisation (SuperLU, COLAMD reordering) is the dominant memory consumer. Fill-in grows empirically as \(O(N^{1.26})\) for a 2-D 13-point stencil — between the \(O(N \log N)\) ideal and the \(O(N^{1.5})\) worst case.
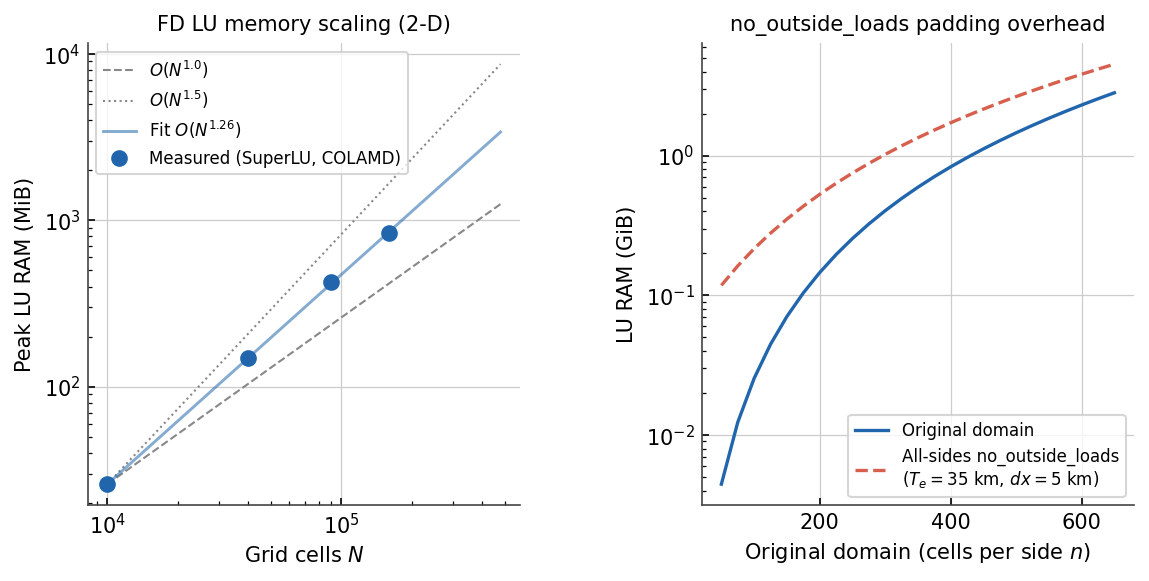
Left: peak LU RAM vs. total cell count for the 2-D FD solver (log-log).
Blue circles are measured values; the blue line is the \(O(N^{1.26})\)
power-law fit; dashed/dotted grey lines are \(O(N^{1.0})\) and
\(O(N^{1.5})\) references.
Right: LU RAM for the original domain (solid blue) versus the domain
after all-sides no_outside_loads padding at \(T_e = 35\) km and
\(dx = 5\) km (dashed red; 67 cells added per padded side). Both lines
use the fitted power law.
The empirical fit gives peak LU RAM as a function of total cell count \(N = n_x \times n_y\):
For a square domain of side \(n\) cells, \(N = n^2\) so \(M \approx 2 \times 10^{-4}\, n^{2.52}\) MiB.
Grid |
Cells \(N\) |
LU RAM |
|---|---|---|
100 × 100 |
10,000 |
26 MiB |
200 × 200 |
40,000 |
148 MiB |
300 × 300 |
90,000 |
423 MiB |
400 × 400 |
160,000 |
838 MiB |
500 × 500 (extrapolated) |
250,000 |
~1.5 GiB |
600 × 600 (extrapolated) |
360,000 |
~2.3 GiB |
The log-log slope is ≈ 1.26. Extrapolating: 700 × 700 ≈ 3.4 GiB; 800 × 800 ≈ 4.8 GiB.
Use benchmarks/bench_memory.py to measure on your own system:
python benchmarks/bench_memory.py          # 100–400×100–400
python benchmarks/bench_memory.py --large  # adds 500×500, 600×600
When cache_factorization=True, the LU factors are kept
in memory between run() calls and the table shows the steady-state
footprint. Without caching (the default) peak RSS briefly spikes to the
tabulated value and then falls.
Effect of no_outside_loads padding on FD memory
When any FD edge is set to no_outside_loads (alias infinite), the
solver automatically pads the domain by one flexural wavelength on each
affected side before solving, then crops w back to the original shape.
The 2-D flexural wavelength is
For \(T_e = 35\) km at standard parameters (\(E = 65\) GPa, \(\nu = 0.25\), \(\rho_m = 3300\) kg m⁻³, \(\rho_\text{fill} = 0\), \(g = 9.8\) m s⁻²) this gives \(\lambda_{2\mathrm{D}} \approx 330\) km. At a 5 km grid spacing, one wavelength is about 67 cells.
Example: 500 × 500 grid at 5 km, all-sides no_outside_loads
Each side gains 67 cells → padded domain: 634 × 634
Cell count: 250,000 → 401,956 (1.6× more cells)
At \(O(N^{1.26})\) scaling: ≈ 1.8× more LU memory (~1.5 GiB → ~2.7 GiB)
Use gflex.recommended_pad_width() to estimate the padded cell count
before running:
from gflex import recommended_pad_width

pad_cells = recommended_pad_width(Te=35e3, dx=5e3)   # → 67 cells
n_padded  = 500 + 2 * pad_cells                       # → 634
print(f"padded domain: {n_padded}×{n_padded} = {n_padded**2:,} cells")
Practical guidance
Choose FFT or SAS when possible. Both require uniform \(T_e\), but their memory scales as \(O(N)\) and they are at least two orders of magnitude faster than FD at the same grid size.
Estimate the padded size before a large FD run.
no_outside_loads BCs are convenient but silently enlarge the problem.
For a 500 × 500 grid with all-sides no_outside_loads, the padded domain
is 634 × 634 and the LU factorisation needs ~2.7 GiB. Grids above ~700 × 700
(padded) exceed 4 GiB and may strain workstation RAM.
Use cache_factorization in coupling loops.
If \(T_e\) and the grid geometry are fixed while only \(q_s\) changes
(transient ice or sediment loading), cache_factorization = True
reuses the LU factors across run() calls. The 7–12× measured speedup at
200×200–400×400 cells is described in the benchmark figures above.
Halve padding if edge accuracy is acceptable.
gflex.recommended_pad_width() accepts n_wavelengths (default 1.0).
Setting n_wavelengths=0.5 halves the padding width at the cost of slightly
larger edge artefacts:
pad_cells = recommended_pad_width(Te=35e3, dx=5e3, n_wavelengths=0.5)